在日常的linux 监控中,可能已经习惯使用vmstat, iostat netstat,nfsstat和ifstat这些命令的工具。 实际上dstat命令是一个更全能系统信息统计工具。
与sysstat相比, dstat拥有一个彩色的界面, 在手动观察性能状况时, 数据比较显眼容易观察; 而且dstat支持即时刷新, 譬如输入dstat 3, 即每三秒收集一次, 但最新的数据都会每秒刷新显示. 和sysstat相同的是, dstat也可以收集指定的性能资源, 譬如 dstat -c 即显示CPU的使用情况。
如果系统没有安装,可以直接使用yum 来安装dstat。
Linux 平台下 YUM 源配置 手册
[root@dave /]# yum list dstat
Loaded plugins: product-id, refresh-packagekit, security, subscription-manager
This system is not registered to Red Hat Subscription Management. You can use subscription-manager to register.
base | 3.9 kB 00:00 ...
Installed Packages
dstat.noarch 0.7.0-1.el6 @base
[root@dave /]#
yum install dstat -y
使用帮助:
[root@dave /]# dstat -h
Usage: dstat [-afv] [options..] [delay [count]]
Versatile tool for generating system resource statistics
Dstat options:
-c, --cpu enable cpu stats
-C 0,3,total include cpu0, cpu3 and total
-d, --disk enable disk stats
-D total,hda include hda and total
-g, --page enable page stats
-i, --int enable interrupt stats
-I 5,eth2 include int5 and interrupt used by eth2
-l, --load enable load stats
-m, --mem enable memory stats
-n, --net enable network stats
-N eth1,total include eth1 and total
-p, --proc enable process stats
-r, --io enable io stats (I/O requests completed)
-s, --swap enable swap stats
-S swap1,total include swap1 and total
-t, --time enable time/date output
-T, --epoch enable time counter (seconds since epoch)
-y, --sys enable system stats
--aio enable aio stats
--fs, --filesystem enable fs stats
--ipc enable ipc stats
--lock enable lock stats
--raw enable raw stats
--socket enable socket stats
--tcp enable tcp stats
--udp enable udp stats
--unix enable unix stats
--vm enable vm stats
--plugin-name enable plugins by plugin name (see manual)
--list list all available plugins
-a, --all equals -cdngy (default)
-f, --full automatically expand -C, -D, -I, -N and -S lists
-v, --vmstat equals -pmgdsc -D total
--bw, --blackonwhite change colors for white background terminal
--float force float values on screen
--integer force integer values on screen
--nocolor disable colors (implies --noupdate)
--noheaders disable repetitive headers
--noupdate disable intermediate updates
--output file write CSV output to file
delay is the delay in seconds between each update (default: 1)
count is the number of updates to display before exiting (default: unlimited)
[root@dave /]#
示例:
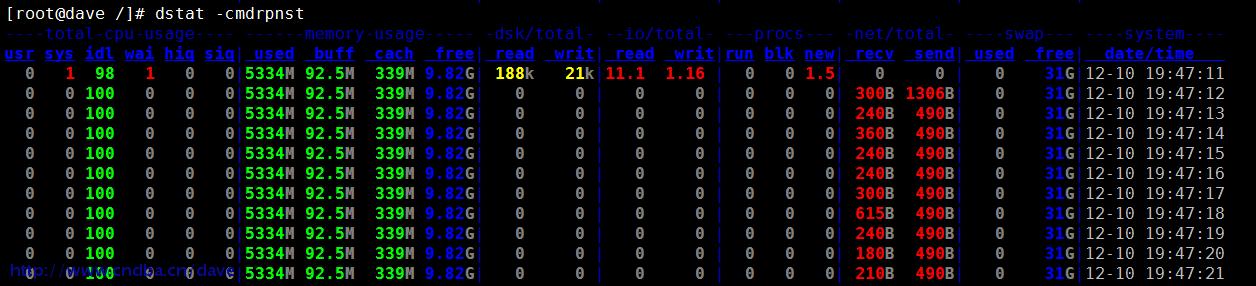
[root@dave /]# dstat -cmdrpnst
----total-cpu-usage---- ------memory-usage----- -dsk/total- --io/total- ---procs--- -net/total- ----swap--- ----system----
usr sys idl wai hiq siq| used buff cach free| read writ| read writ|run blk new| recv send| used free| date/time
0 1 98 1 0 0|5334M 92.5M 339M 9.82G| 188k 21k|11.1 1.16 | 0 0 1.5| 0 0 | 0 31G|12-10 19:47:11
0 0 100 0 0 0|5334M 92.5M 339M 9.82G| 0 0 | 0 0 | 0 0 0| 300B 1306B| 0 31G|12-10 19:47:12
0 0 100 0 0 0|5334M 92.5M 339M 9.82G| 0 0 | 0 0 | 0 0 0| 240B 490B| 0 31G|12-10 19:47:13
0 0 100 0 0 0|5334M 92.5M 339M 9.82G| 0 0 | 0 0 | 0 0 0| 360B 490B| 0 31G|12-10 19:47:14
0 0 100 0 0 0|5334M 92.5M 339M 9.82G| 0 0 | 0 0 | 0 0 0| 240B 490B| 0 31G|12-10 19:47:15
0 0 100 0 0 0|5334M 92.5M 339M 9.82G| 0 0 | 0 0 | 0 0 0| 240B 490B| 0 31G|12-10 19:47:16
0 0 100 0 0 0|5334M 92.5M 339M 9.82G| 0 0 | 0 0 | 0 0 0| 300B 490B| 0 31G|12-10 19:47:17
0 0 100 0 0 0|5334M 92.5M 339M 9.82G| 0 0 | 0 0 | 0 0 0| 615B 490B| 0 31G|12-10 19:47:18
0 0 100 0 0 0|5334M 92.5M 339M 9.82G| 0 0 | 0 0 | 0 0 0| 240B 490B| 0 31G|12-10 19:47:19
0 0 100 0 0 0|5334M 92.5M 339M 9.82G| 0 0 | 0 0 | 0 0 0| 180B 490B| 0 31G|12-10 19:47:20
0 0 100 0 0 0|5334M 92.5M 339M 9.82G| 0 0 | 0 0 | 0 0 0| 210B 490B| 0 31G|12-10 19:47:21
版权声明:本文为博主原创文章,未经博主允许不得转载。